Exploratory Data Analysis - Intersect Mode
Perform basic aggregate statistics on the column of an overlapping dataset created via PRL
The Exploratory Data Analysis (EDA) Intersect feature for private record linkage (PRL) sessions enables you to access summary statistics about a group of datasets without needing access to the data itself. This enables you to get a basic understanding of the dataset when you don't have access to the data or you are not allowed to do any computations on the data. It helps you to understand more about the intersection between two datasets.
EDA is an important pre-step for federated modelling and a simple form of federated analytics. The feature has a built-in differential privacy setting. Differential privacy (DP) is dynamically added to each histogram that is generated for each feature in a participating dataset. The added privacy protection causes slight noise in the end result.
At a high level, the process is similar to that of creating and running a session to train a model. The steps are:
Run a PRL session to determine the intersection between your datasets.
Configure an EDA Intersect session.
Create and start the session.
Run the session and poll for session status.
Analyse the results.
Use the integrateai_eda_intersect_batch.ipynb notebook to follow along and test the examples shown below by filling in your own variables as required.
This documentation provides supplementary and conceptual information to expand on the code demonstration.
API Reference
The core API module that contains the EDA-specific functionality is integrate_ai_sdk.api.eda. This module includes a core object called EdaResults, which contains the results of an EDA session.
If you are comfortable working with the integrate.ai SDK and API, see the API Documentation for details.
Configure an EDA Intersect Session
This example uses AWS Batch to run the session using data in S3 buckets. Ensure that you have completed the Environment Setup and that you have the correct roles and policies for AWS Batch and Fargate. See Using AWS Batch with integrate.ai for details.
To begin exploratory data analysis in Intersect mode, you must first create a session, the same as you would for training a model.
To configure the session, specify the following:
EDA data configuration (
eda_data_config)EDA configuration (
eda_config)prl_session_idfor the PRL session you want to work with. See Private Record Linkage (PRL) sessions for details.
The eda_data_config specifies the names of the datasets used to generate the intersection in the PRL session in the format dataset_name : columns. If columns is empty ([]), then EDA Intersect is performed on all columns.
Exclude any columns that were used as identifiers during the PRL sessions.
The eda_config specifies the parameters for the EDA process, such as the strategy.
You must also specify the session ID of a successful PRL session using the datasets listed in the eda_data_config.
Example:
If we need to find the correlation (or any other binary operation) between two specific columns, we should specify those columns in paired columns so the 2D histogram gets calculated for those columns.
To set which pairs you are interested in, specify their names in a dictionary like data_config.
For example: {"passive_client": ['x1', 'x5'], "active_client": ['x0', 'x2']}
will generate 2D histograms for these pairs of columns:
(x0, x1), (x0, x5), (x2, x1), (x2, x5), (x0, x2), (x1, x5)
Create and start an EDA Intersect session
The following code sample demonstrates creating and starting an EDA session to perform privacy-preserving data analysis on the intersection of two distinct datasets.
It returns an EDA session ID that you can use to track and reference your session.
For more information, see the create_eda_session() definition in the API documentation.
Start an EDA Intersect session using AWS Batch
The data paths and client names must match the information used in the PRL session.
Specify your AWS credentials if you are generating temporary ones. Otherwise, use the default profile credentials.
Set up the task builder and task group.
Import the taskbuilder and taskgroup from the SDK.
Specify the batch information to create the task builder object.
Create a task in the task group for each client. The number of tasks in the task group must match the number of clients specified in the data_config used to create the session.
The dataset_name specified in the task must be identical to the client_name specified in the PRL session.
The vcpus and memory parameters are optional overrides for the job definition.
Monitor submitted jobs
Each task in the task group kicks off a job in AWS Batch. You can monitor the jobs through the console or the SDK.
The following code returns the session ID that is included in the job name.
Next, check the status of the tasks.
Submitted tasks are in the pending state until the clients join and the session is started. Once started, the status changes to running.
When the session completes successfully, "True" is returned. Otherwise, an error message appears.
Analyse the results
To retrieve the results of the session:
Example output:
EDA Session collection of datasets: ['active_client', 'passive_client']
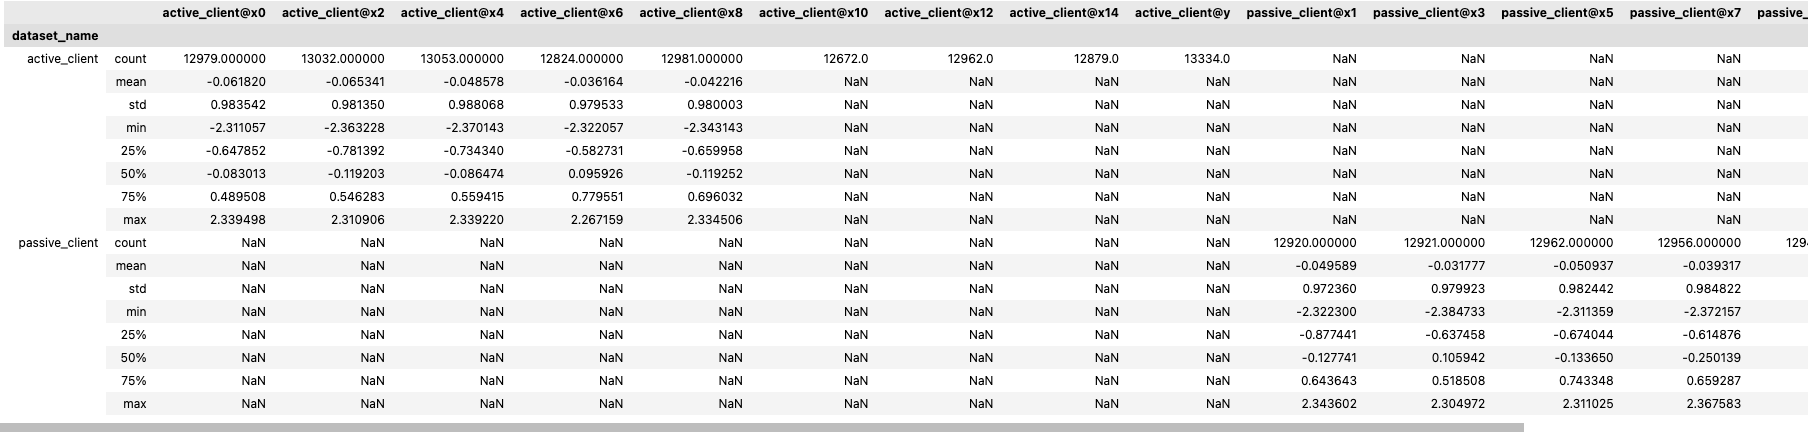
Describe
You can use the .describe() function to review the results.
Example output:
Statistics
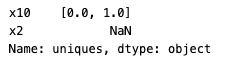
For categorical columns, you can use other statistics for further exploration. For example, unique_count, mode, and uniques.
Example output:
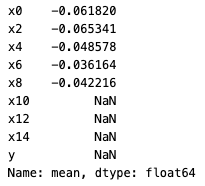
Mean
You can call functions such as .mean(), .median(), and .std() individually.
Example output:
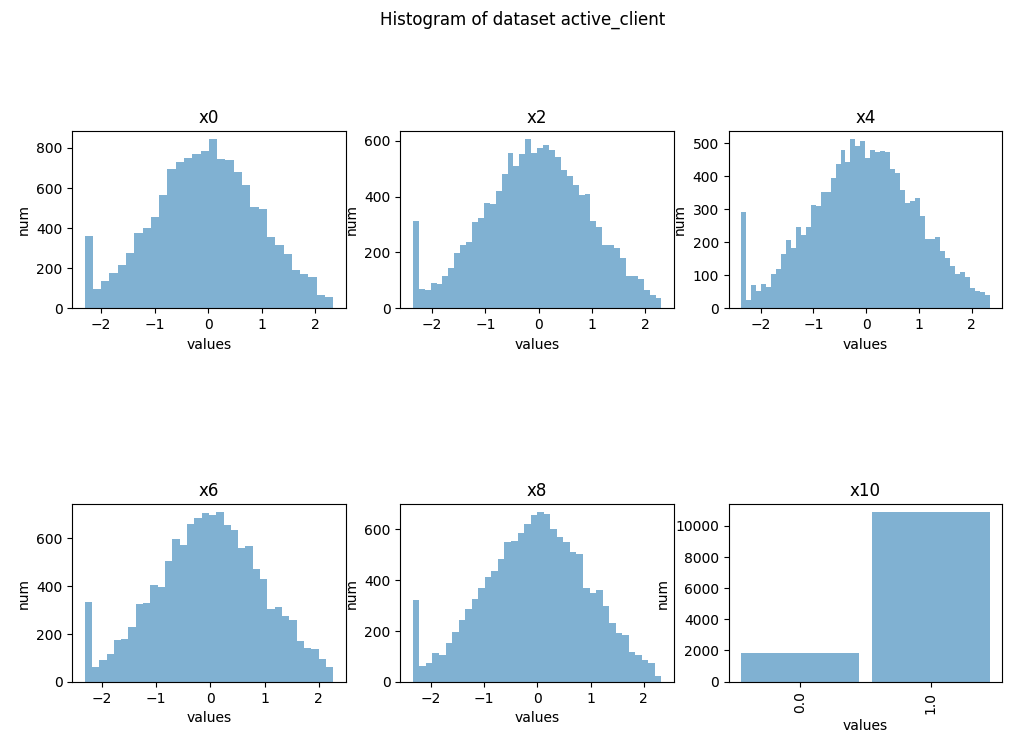
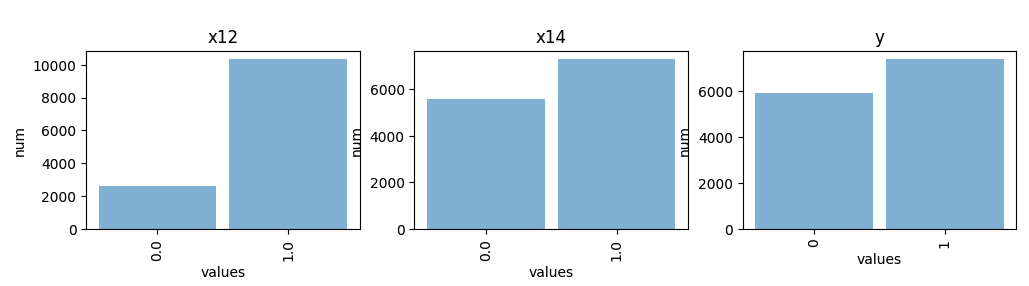
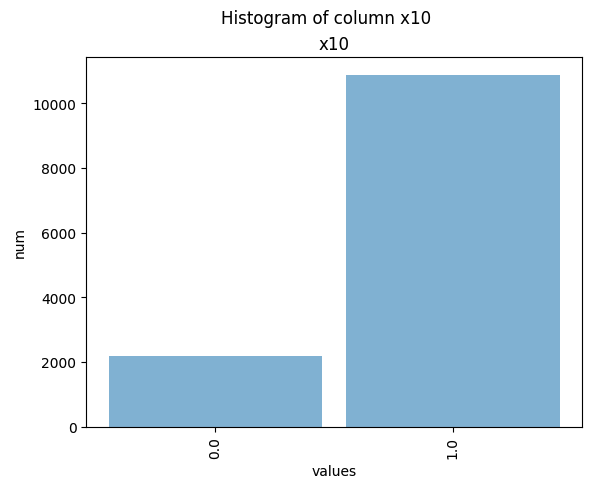
Histograms
You can create histogram plots using the .plot_hist() function.
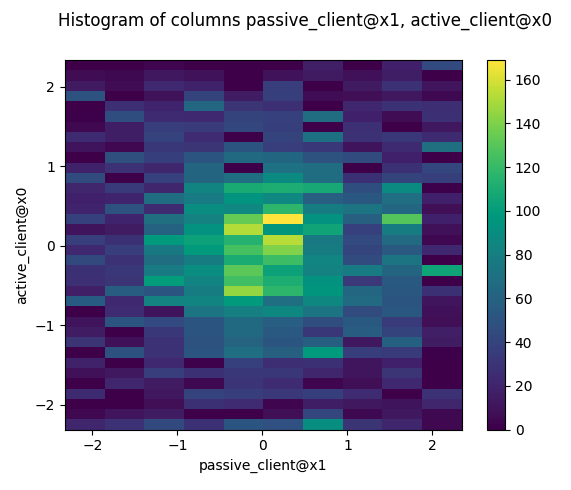
2D Histograms
You can also plot 2D-Histograms of specified paired columns.
Example output:
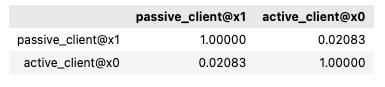
Correlation
You can perform binary calculations on columns specified in paired_columns, such as finding the correlation.
Example output:
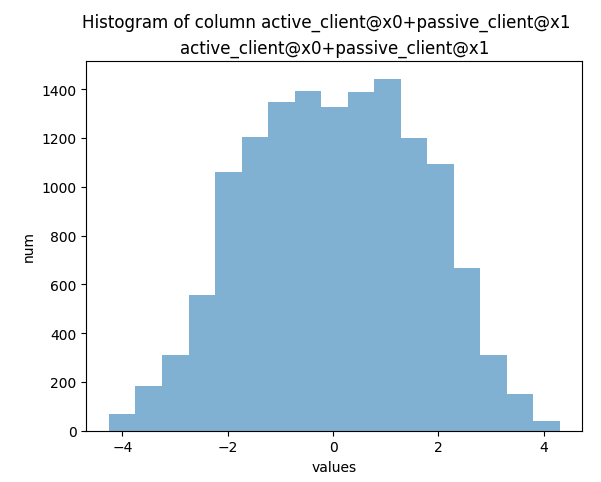
Addition, subtraction, division
Example output:
GroupBy
Last updated