Exploratory Data Analysis - Individual Mode
An introduction to HFL-EDA with integrate.ai
The Exploratory Data Analysis (EDA) feature for horizontal federated learning (HFL) enables you to access summary statistics about a group of datasets without needing access to the data itself. This allows you to get a basic understanding of the dataset when you don't have access to the data or you are not allowed to do any computations on the data.
EDA is an important pre-step for federated modelling and a simple form of federated analytics. The feature has a built in differential privacy setting. Differential privacy (DP) is dynamically added to each histogram that is generated for each feature in a participating dataset. The added privacy protection causes slight noise in the end result.
At a high level, the process is similar to that of creating and running a session to train a model. The steps are:
Configure an EDA session in Individual mode.
Create and start the session.
Run the session and poll for session status.
Analyse the datasets.
The sample notebook (integrate_ai_api.ipynb) is an interactive tool for exploring the API, including the EDA feature, and should be used in parallel with this tutorial. This documentation provides supplementary and conceptual information to expand on the code demonstration.
API Reference
The core API module that contains the EDA-specific functionality is integrate_ai_sdk.api.eda. This module includes a core object called EdaResults, which contains the results of an EDA session.
If you are comfortable working with the integrate.ai SDK and API, see the API Documentation for details.
This tutorial assumes that you have correctly configured your environment for working with integrate.ai, as described in Environment Setup.
Configure an EDA Session
To begin exploratory data analysis, you must first create a session, the same as you would for training a model. In this case, to configure the session, you must specify either the dataset_config, or num_datasets argument.
Using a dataset_config file
The dataset_config file is a configuration file that maps the name of one or more datasets to the columns to be pulled. Dataset names and column names are specified as key-value pairs in the file.
For each pair, the keys are dataset names that are expected for the EDA analysis. The values are a list of corresponding columns. The list of columns can be specified as column names (strings), column indices (integers), or a blank list to retrieve all columns from that particular dataset.
If a dataset name is not included in the configuration file, all columns from that dataset are used by default.
For example:
To retrieve all columns for a submitted dataset named dataset_one:
To retrieve the first column and the column x2 for a submitted dataset named dataset_one:
To retrieve the first column and the column x2 for a submitted dataset named dataset_one and all columns in a dataset named dataset_two:
Specifying the number of datasets
You can manually set the number of datasets that are expected to be submitted for an EDA session by specifying a value for num_datasets.
If num_datasets is not specified, the number is inferred from the number of datasets provided in dataset_config.
Create and start an EDA session
The following code sample demonstrates creating and starting an EDA session to perform privacy-preserving data analysis on two datasets, named dataset_one and dataset_two. It returns an EDA session ID that you can use to track and reference your session.
The dataset config used here specifies that the first column (x1), x5, and x7 will be analyzed for dataset_one and columns x1, x10, and x11 will be analyzed for dataset_two.
Since the num_datasets argument is not provided to client.create_eda_session(), the number of datasets is inferred as two from the dataset_config.
For more information, see the create_eda_session() definition in the API documentation.
Poll for session status
You can log information about the session during this time. This example only checks for session completion.
Ending an EDA Session manually
During the EDA session configuration stage, if too many datasets were specified and you want to complete the session without connecting any new clients, call either client.end_session(<eda_session.id>) or eda_session.end().
Analyse the datasets
The results object is a dataset collection comprised of multiple datasets that can be retrieved by name. Each dataset is comprised of columns that can be retrieved by either column name or by index.
The same base analysis functions can be performed at the collection, dataset, or column level.
Example output:
EDA Session collection of datasets: ['dataset_two', 'dataset_one']
Describe
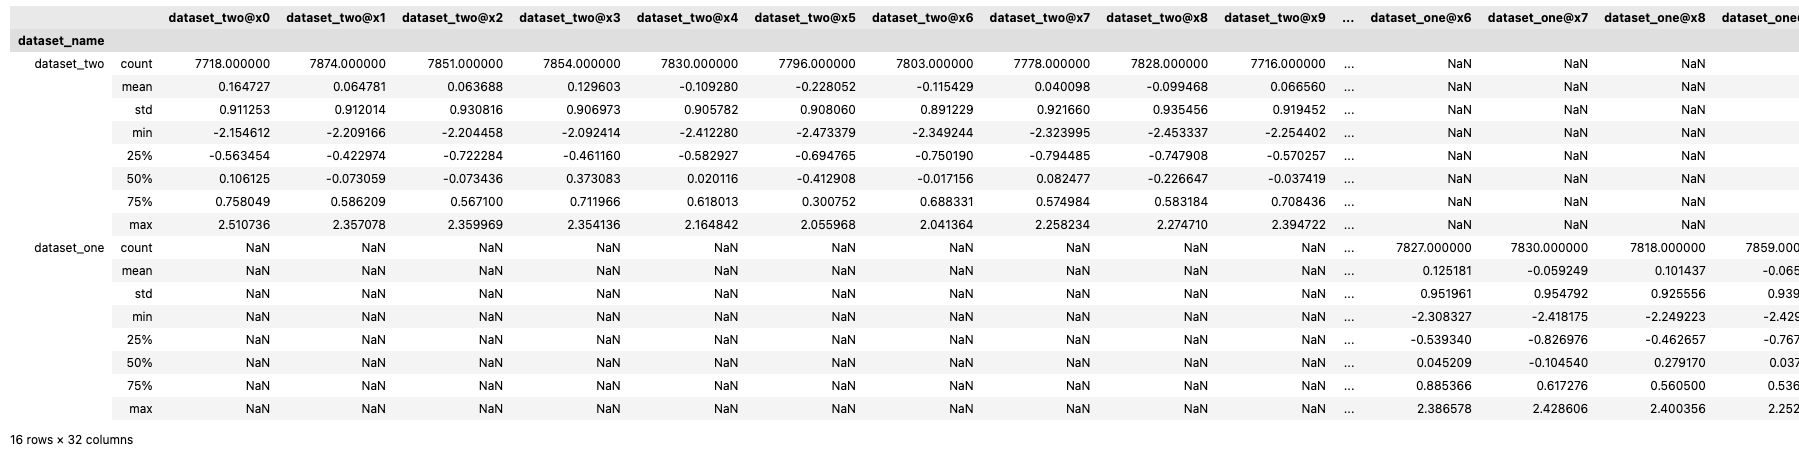
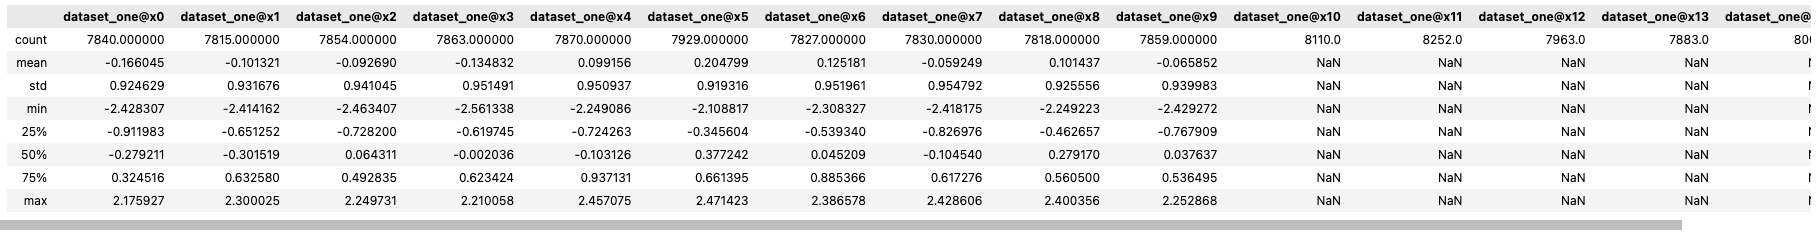
The .describe() method can be used to retrieve a standard set of descriptive statistics.
If a statistical function is invalid for a column (for example, mean requires a continuous column and x10 is categorical), or the column from one dataset is not present in the other (for example, here x5 is in dataset_one, but not dataset_two), then the result is NaN.
Statistics
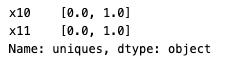
For categorical columns, you can use other statistics for further exploration. For example, unique_count, mode, and uniques.
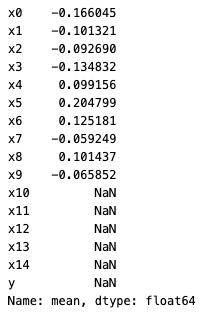
You can call functions such as .mean(), .median(), and .std() individually.
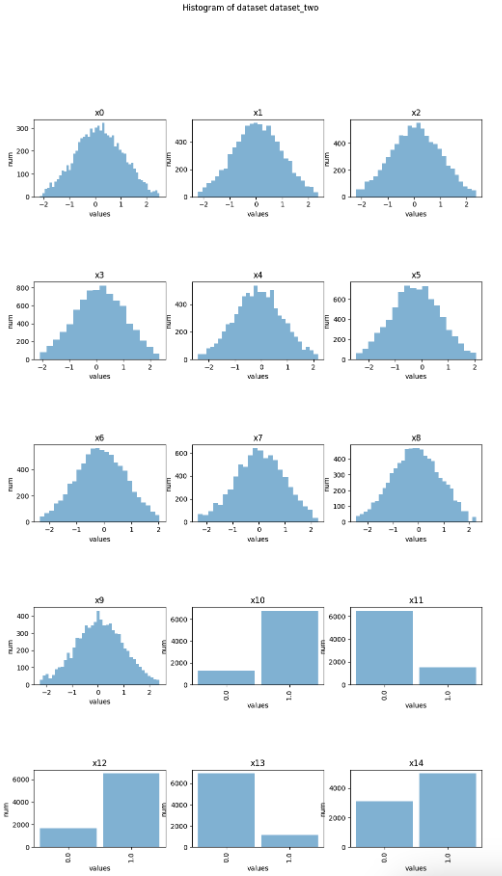
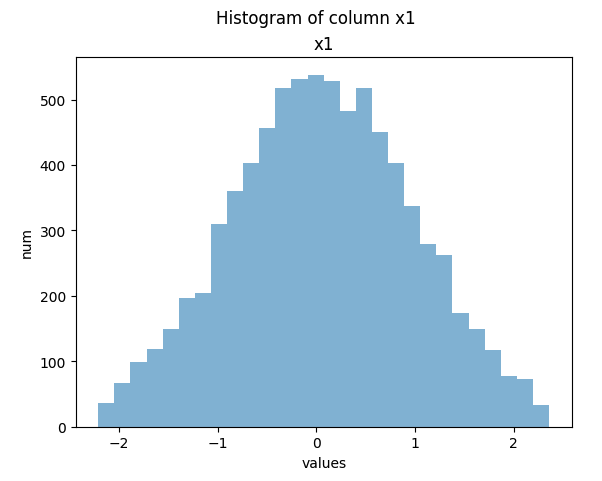
Histograms
You can create histogram plots using the .plot_hist() function.
Last updated